Digital Tech & Links
We will be using quite a bit of technology in this course to facilitate learning. The hope is that it will make things easier for everyone!
- Blackboard: official grades, class-wide communications, R assignment postings, slides and videos
- WeBWorK: assignments (digital)
- Chat (‘Discord’): asking questions, communicating, sharing, talking to the TAs and me; also class-wide communications (announcements)
- RStudio: learning to do statistics and data analysis (5 assignments) - new computer program
- Video Chat: we will be available to video chat via Zoom
WeBWorK
- Linked from Blackboard
- First assignment (of two!) already live (more nuance in a moment)
- Multiple attempts (varies by question)
- Some questions require that you get all parts correct to get the point; others give partial credit. Read carefully to tell the difference (it’s at the bottom, in italics)
- Assignments due twice (or more) through the term - worth 20% of your grade total.
Discord Chat Interface
- persistent
- multiple user
- replaces email (for all content and non-personal questions)
- where the TAs and professors will spend time outside of class & office hours
- there’s a video on Blackboard on installing the program, and a quick guide to using it
- link to join is in Blackboard -> SETUP: Discord
RStudio
The R programming language and interface is the language of statistics in the 21st century.
- MATH 1051H is not a traditional mathematics course
- Statistics blends mathematics, probability, computer science, data analysis, data science, and philosophy
- You will be learning to do data analysis using R in this class
- Many ways to use RStudio - there are videos on Blackboard going through them, and then separate videos going through how to install and use the program
Course Overview
Now I’d like to go over the course with you.
Posted Material
- Lectures: 3 hours per week
- Labs: one topic per week, organized sequentially (numbered 1-12) – pre-lab
- Problem solving: ~1 hour per week of the lectures, typically on Mondays
- Extra topics: as often as needed, with announcements
- Summary: every week Wesley will post a summary and chat reminding you of what we’re doing and where we’re going (posted on Wednesdays, our ‘last day of the week’)
Texts & Software
- Introduction to Modern Statistics (2nd edition: free PDF, or order a paper copy from the Trent Bookstore or Amazon)
- Calculator: strongly recommend you don’t use one - use R instead!
- R & RStudio: free for your personal computer, free using Remote Desktop through Trent
- We also have an RStudio cloud server available for those individuals with Chromebooks, tablets, etc.. https://sage.trentu.ca
The Textbook
The textbook we are using is an open-source CC-BY statistics textbook written by some excellent folks. The PDF is completely free if you want it, and I encourage all of you to at least get a copy of the 2nd Edition.
There is a link to the 2nd Edition on Blackboard.
Things Worth Marks
- WeBWork: 20%
- 15% for doing the questions; 5% for handing in your study guides
- Lab Mini-Exercises: 10%
- Best 8 out of 12 count towards your final grade
- R Assignments: 40%
- Best 4 of 5 count towards your final grade
- Final Exam: 30%
- Two parts, 15% each (more info later in the semester)
WeBWorK (20%)
WeBWorK is an open-source homework system with automatically graded problems. It allows for some fun things like multiple attempts, and in-response math (e.g., you can input “[ 2 * 2 + 2 ]” and it will be recognized).
- You will be required to submit a document showing your rough work as well
- This is actually us being sneaky and helping you study for the open-book final exam ….
We’re trying something new this year. You can choose one of two paths:
- weekly WeBWorK assignments, due every Friday night after the first week
- bi-semester “block” assignments, due at the halfway and concluding point of the semester
- you can switch from weekly to block at your volition, but your progress does not transfer (and you cannot switch the other way)
Whyyyyyyy
We used to do weekly deadlines for the assignments. Students complained it was too much work, too stressful. We listened. We moved the assignments to be “at your own pace”. Students complained it was too flexible, too little structure, too stressful. We … listened?
Basically, in a big class, you can’t make everyone happy. So …
![]()
So How Does It Work?
Weekly assignments. 12 of them. They have deadlines. There are no extensions (it’s just too much work to manage for a huge class). At any point, you can decide you’d rather just work on the big six-week “block” assignment.
Move over, work on it.
But your progress does not transfer. That’s the cost. That’s the trade-off.
Hint: you will all have access to both. So … you can use one of them as ‘practice’ runs if you really want perfect on the assignments. Extra attempts!
Which one counts? Whichever is higher. We’ll compute both. Higher grade survives. Thunderdome of pedagogy.
Labs (10%, 8x1.25%)
- The labs will be very applied.
- Required PRE-LAB video to be watched before your lab time (just watch the damn videos)
- Ideas or techniques will be reinforced and demonstrated in R by one of our wonderful TAs, followed by time to practice and / or get help.
- Each lab will have an associated “mini-exercise”.
- You should be able to complete and hand this in during (or even BEFORE!) the lab.
- Best 8 out of 12 count, 1.25% each
R Assignments (40%, 4x10%)
- The R assignments are designed to assess your learning of the material covered mostly in the labs, and demonstrated in class.
- The first will be a simple syntax check, seeing if you’ve learned how to create documents and use basic features.
- Due dates are provided in the syllabus, and on Blackboard announcements
- Best 4 of 5 count (work hard, take #5 off, because it’s due at the end of term)
How to Get Help
- Discord course channel: anytime (rotating coverage of TAs and Profs)
- Office hours: tentative schedule already posted, starts tomorrow
- Read the textbook!
- Google is surprisingly helpful for learning R stuff - there’s a huge wealth of material out there for beginners, some of which we will link to through the term
Let’s Talk about AI
The massive growth in LLMs (“AI”) has been impressive, and I assume most of you have tried to use them at least a little bit. They’re seductive tools, promising to answer questions with accuracy in plain English. They also lie their asses off.
My policy on AI in this course is fairly draconian: if I look at a piece of your work, and it shows signs of having been generated by an AI, you get a 0 and a warning. If you do it again, you get an Academic Integrity violation and a nice little write-up that goes to the Dean.
(and I’ve been doing this for a while: I know what AI-generated drivel looks like as compared to good-faith student-learning attempts)
Why Am I So Draconian?
Essentially, you don’t know enough about this topic to use an AI on it. Someone with experience can use these tools somewhat safely: they know enough to do it on their own, so when they use the tool, they can look at the output and have a sense of whether it worked, or not.
You do not know what you are you doing (yet!). So you can’t safely use these tools. Yet. If you continue to 1052H, we relax the rules in that class, and start showing you how we can safely use these tools without embarrassing ourselves.
Analogy
Handing all of you an AI tool like ChatGPT or Copilot, and you funnelling all your work in this course through it, is equivalent to handing a 12 year old the keys to your “Full Self Driving” Tesla, and telling them to drive to Toronto. Everything will seem fine for a while, and the “AI” in the Tesla will keep them from smashing into things … for a while. And then it’ll end horribly. It certainly isn’t going to teach them how to drive a car.
And my goal here is to teach you how to do statistical analyses. Once you know how to do things, then these tools can (maybe) be useful for you. Not before.
If you want some scientific peer-reviewed evidence about the damage that use of LLMs does to your critical reasoning skills, ping Wesley on Discord.
COVID-19
We are back at it for a seventh? year with COVID-19.
Trent is “mask friendly”:
Masks continue to be optional on Trent’s campuses and we respect the decision of students, staff and faculty regarding their choice on masking. The University strongly encourages wearing a mask in spaces that have high-capacity limits and limited ability for physical distancing. Masks are available at college offices, the libraries on both campuses, as well as the Student Centre.
If you are ill / feeling unwell: please do not come to class.
Classes will be available live via Zoom and recorded / posted the same day.
Some Final Housekeeping Business
- WeBWork grades are transferred to Blackboard within 24 hours.
- Your grade on Blackboard will update continuously as you are completing questions.
- If you start a question, it counts as 0 points earned
- Submitting work on Crowdmark
- Lectures
- Live Zoom lectures
- Recorded lectures
- Recorded labs
Case Study: Treating Chronic
Fatigue Syndrome
Treating Chronic Fatigue Syndrome1
Objective. Evaluate the effectiveness of cognitive-behaviour therapy for chronic fatigue syndrome.
Participant pool. 142 patients who were recruited from referrals by primary care physicians and consultants to a hospital clinic specializing in chronic fatigue syndrome.
Actual participants. Only 60 of the 142 referred patients entered the study. Some were excluded because they didn’t meet the diagnostic criteria, some had other health issues, and some refused to be a part of the study.
Study Design
Patients were randomly assigned to treatment and control groups, 30 patients in each group:
Treatment: Cognitive behaviour therapy \(-\) collaborative, educative, and with a behavioural emphasis. Patients were shown on how activity could be increased steadily and safely without exacerbating symptoms.
Control: Relaxation \(-\) No advice was given about how activity could be increased. Instead progressive muscle relaxation, visualization, and rapid relaxation skills were taught.
Results
The table below shows the distribution of patients with good outcomes at 6-month follow-up. Note that 7 patients dropped out of the study: 3 from the treatment and 4 from the control group.
Proportion with good outcomes
|
Yes |
No |
Total |
| Groups |
| Treatment |
19 |
8 |
27 |
| Control |
5 |
21 |
26 |
| Total |
|
24 |
29 |
53 |
- Treatment Group: 19/27 = 0.70 = 70%
- Control Group: 5/26 = 0.19 = 19%
Understanding the results
Do the data show a “real” difference between the groups?
- Suppose you flip a coin 100 times.
- While the chance a coin lands heads in any given coin flip is 50%, we probably won’t observe exactly 50 heads.
- This type of fluctuation is part of most types of data generating process.
Our Study:
- The observed difference between the two groups (70 - 19 = 51%) may be real, or may be due to natural variation.
- Since the difference is quite large, it is more believable that the difference is real.
- We use statistical tools to determine if the difference is so large that we should reject the notion that it was due to chance.
Generalizing the resultse
Are the results of this study generalizable to all patients with chronic fatigue syndrome?
- No. These patients had specific characteristics and volunteered to be a part of this study, therefore they may not be representative of all patients with chronic fatigue syndrome.
- While we cannot immediately generalize the results to all patients, this first study is encouraging.
- The method at least works for patients with some narrow set of characteristics, and that gives hope that it will work, at least to some degree, with other patients.
Data matrix
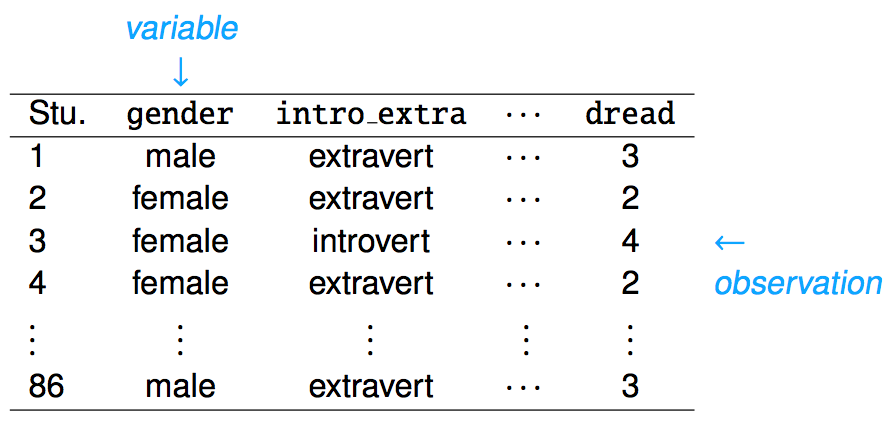
Data collected on students in a statistics class on a variety of variables. The variable dread is a Likert scale for the level of dread students feel for the topic of statistics.
![]()
Types of variables
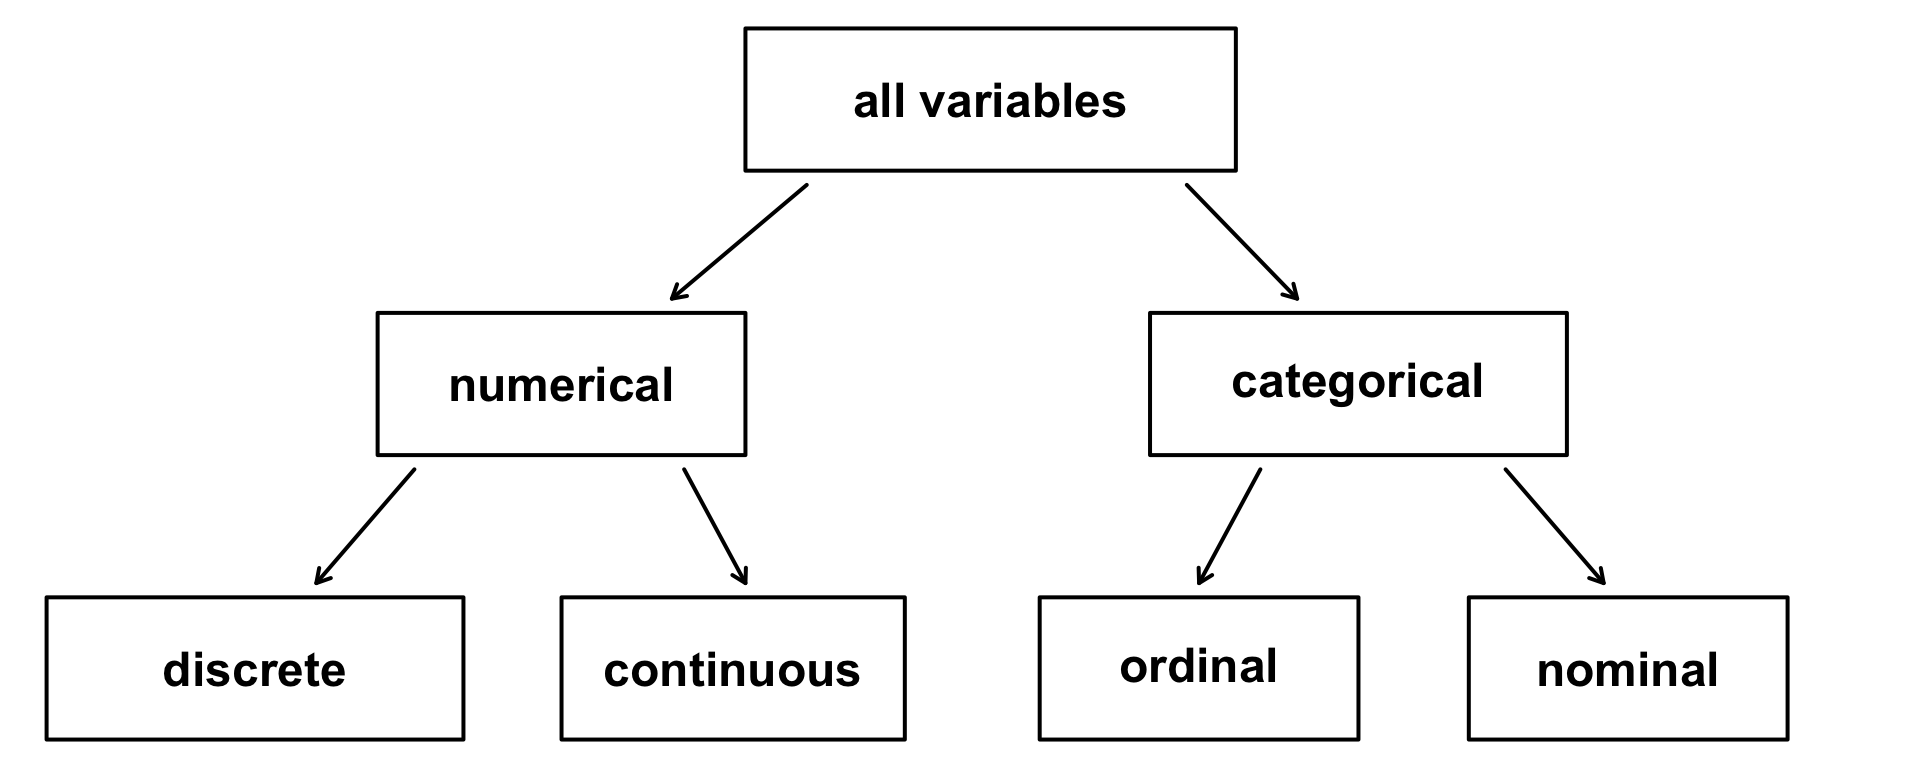
![Types of variables are broken down into numerical (which can be discrete or continuous) and categorical (which can be ordinal or nominal).]()
Figure 1: Breakdown of variables into their respective types.
Figure adapted from OpenIntro Statistics, Introduction to Modern Statistics, Figure 1.1
Types of variables (cont.)
![]()
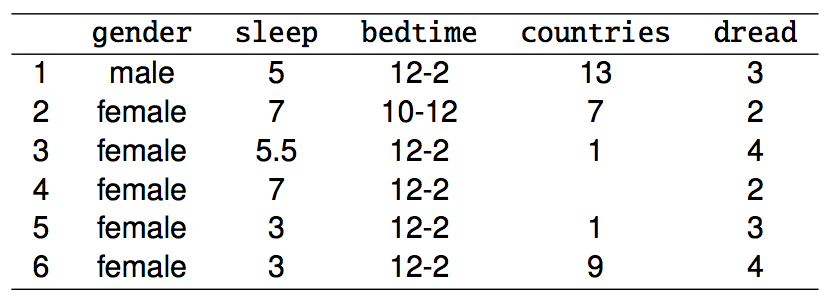
- dread
- categorical, ordinal (could also be used as numerical)
Why Do We Need to Care?
The type of data determines the type of analysis that you can perform and the statistics that make sense.
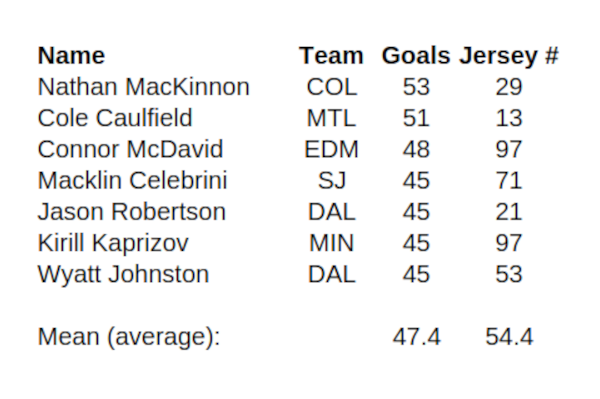
Example: Top hockey players in the NHL according to goals (regular season) in 2025-2026.
- The mean number of goals is a value that makes sense. The variable Number of Goals is numerical.
- The mean jersey number is a value that does not make sense. The variable Jersey Number is not numerical.
- If considering jersey numbers, the proportion of players with even jersey numbers is a value that makes sense. The variable Odd or Even Jersey Number is categorical.
Practice
What type of variable is a telephone area code?
- numerical, continuous
- numerical, discrete
- categorical
- categorical, ordinal
Practice
What type of variable is a telephone area code?
- numerical, continuous
- numerical, discrete
- categorical
- categorical, ordinal
Numerical Data
Numerical (or quantitative) data are numbers representing counts or measurements.
- Weights of athletes
- Number of siblings
- GPA
Working with Numerical Data
We can further distinguish between numerical data by breaking them into two types:
- discrete numerical data (integers)
- continuous numerical data (real numbers)
Discrete Examples:
- count of books;
- number of siblings;
- number of bullet holes;
(often these are going to be counts)
Continuous Examples:
- ml of wine in a glass;
- weight of tofu purchased;
- age of the galaxy in seconds;
- amount of CO\(_{2}\) emitted
Categorical Data
Categorical (or qualitative) data are names or labels (categories!)
- country codes for telephones (e.g., USA and Canada are 1)
- Social Insurance Numbers (e.g., 516 248 917 - Canadian system)
- car colours (red, blue, green, … fuchsia?)
Ordinal Data
Ordinal Data are categorical data which have a natural order structure
- days of the week (Sunday, Monday, …)
- months of the year (January, February, …)
- letter grades (A, B, C, D, F)
- ranking scheme (Excellent, Good, Fair, Poor)
Overview of Data Collection Principles
Populations and Samples
![]()
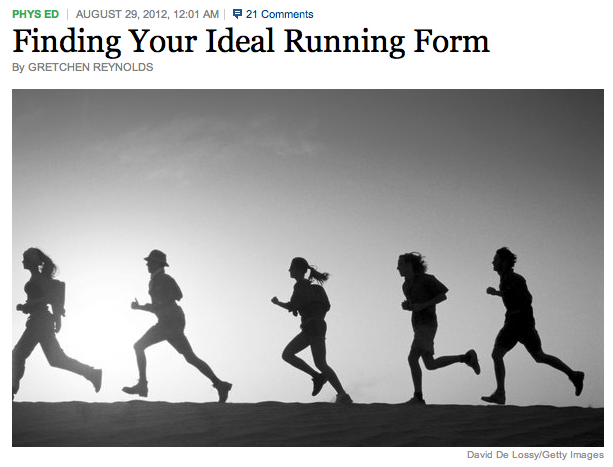
Research Question Can people become better, more efficient runners on their own, merely by running?
Population of Interest All people
Sample Group of adult women who recently joined a running group
Population to which results can be generalized Adult women, if the data are randomly sampled
Image source: http://well.blogs.nytimes.com/2012/08/29/finding-your-ideal-running-form
Populations and Samples
A population is the set of individuals or objects that we want to learn about.
A sample is a subset of the population. The hope is that it will be representative, so that if we learn about the sample, we can generalize to the population.
Anecdotal Evidence: Early Smoking Research
- Anti-smoking research started in the 1930s and 1940s when cigarette smoking became increasingly popular. While some smokers seemed to be sensitive to cigarette smoke, others were completely unaffected.
- Anti-smoking research was faced with resistance based on anecdotal evidence such as “My uncle smokes three packs a day and he’s in perfectly good health”: a limited sample size that might not be representative1
- It was concluded that “smoking is a complex human behaviour, by its nature difficult to study, confounded by human variability.”
- In time researchers were able to examine larger samples of cases (smokers), and trends showing that smoking has negative health impacts became much clearer.
Census
- Wouldn’t it be better to just include everyone and “sample” the entire population?
- There are problems with taking a census:
- It can be difficult to complete a census: there always seem to be some individuals who are hard to locate or hard to measure. And these difficult-to-find people may have certain characteristics that distinguish them from the rest of the population.
- Populations rarely stand still. Even if you could take a census, the population changes constantly, so it’s never possible to get a perfect measure.
- Taking a census may be more complex than sampling.
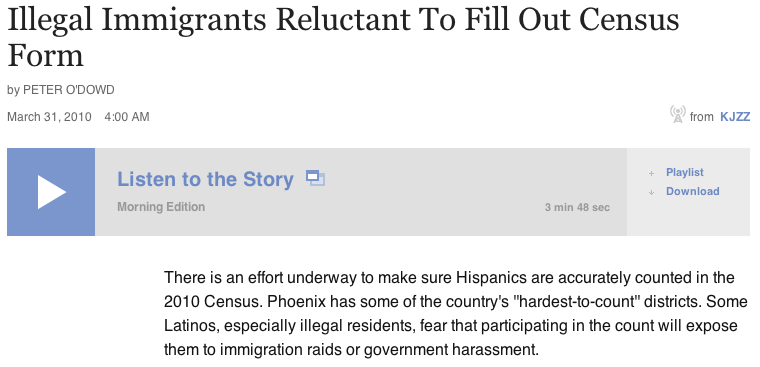
Censuses can have issues with response1.
How about a survey instead?
In 2010, Stephen Harper’s Conservative government scrapped the expected 2011 mandatory Canadian long-form census, and replaced it with voluntary short-form surveys. The results were horrifically bad.
The response rate plummeted from 93% to 65%, and the data from the survey was so unusable that to this day, the data for 2009-13 is mostly interpolated from the two actual censuses run in 2006 and 2016. If you’d like to read more, you can read a short retrospective at Science.org, or a contemporary commentary from a professor at the University of Alberta.
Exploratory Analysis to Inference
- Sampling is natural.
- Think about sampling something you are cooking - you taste (examine) a small part of what you’re cooking to get an idea about the dish as a whole.
- When you taste a spoonful of soup and decide the spoonful you tasted isn’t salty enough, that’s exploratory analysis.
- If you generalize and conclude that your entire soup needs salt, that’s an inference.
- For your inference to be valid, the spoonful you tasted (the sample) needs to be representative of the entire pot (the population).
- If your spoonful comes only from the surface and the salt is collected at the bottom of the pot, what you tasted is probably not representative of the whole pot.
- If you first stir the soup thoroughly before you taste, your spoonful will more likely be representative of the whole pot.
Sampling bias
Non-response: If only a small fraction of the randomly sampled people choose to respond to a survey, the sample may no longer be representative of the population.
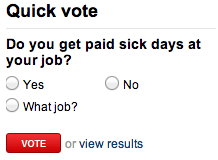
Voluntary response: Occurs when the sample consists of people who volunteer to respond because they have strong opinions on the issue. Such a sample will also not be representative of the population.
Convenience sample: Individuals who are easily accessible are more likely to be included in the sample.
Sampling Bias Example: Landon versus FDR (USA)
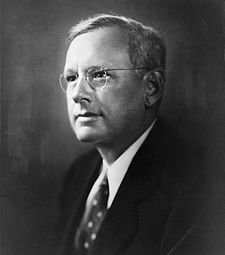
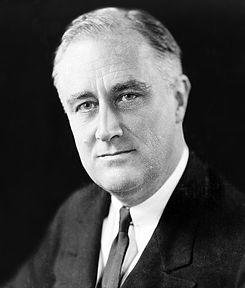
A historical example of a biased sample yielding misleading results. In 1936, Alf Landon became the Republican presidential nominee, opposing the re-election of Franklin Delano Roosevelt, a Democrat, for the United States presidential election.
The Literary Digest Poll
- The Literary Digest polled about 10 million Americans, and got responses from about 2.4 million.
- The poll showed that Landon would likely be the overwhelming winner and FDR would get only 43% of the votes.
- Election result: FDR won, with 62% of the votes (and 98.5% of the electoral votes \(-\) the most lop-sided electoral vote victory in US history).
- The magazine was completely discredited because of the poll, and was soon discontinued.
The Literary Digest Poll \(-\) what went wrong?
The magazine had surveyed:
- its own readers,
- registered automobile owners, and
- registered telephone users.
These groups had incomes well above the national average of the day (remember, this is Great Depression era) which resulted in lists of voters far more likely to support Republicans than a truly typical voter of the time, i.e., the sample was not representative of the American population at the time.
Large samples are preferable, but …
- The Literary Digest election poll was based on a sample size of 2.4 million, which is huge, but since the sample was biased, the sample did not yield an accurate prediction.
- Back to the soup analogy: If the soup is not well mixed (stirred), it doesn’t matter how large a spoon you have, it will still not taste right. If the soup is well mixed, a small spoon will suffice to test the soup.
Practice
A school district is considering whether it will no longer allow high school students to park at school after two recent accidents where students were severely injured. As a first step, they survey parents by mail, asking them whether or not the parents would object to this policy change. Of 6,000 surveys that go out, 1,200 are returned. Of these 1,200 surveys that were completed, 960 agreed with the policy change and 240 disagreed. Which of the following statements are true?
- Some of the mailings may have never reached the parents.
- The school district has strong support from parents to move forward with the policy approval.
- It is possible that majority of the parents of high school students disagree with the policy change.
- The survey results are unlikely to be biased because all parents were mailed a survey.
(a) Only 1 (b) 1 and 2 (c) 1 and 3 (d) 3 and 4 (e) Only 4
Practice
A school district is considering whether it will no longer allow high school students to park at school after two recent accidents where students were severely injured. As a first step, they survey parents by mail, asking them whether or not the parents would object to this policy change. Of 6,000 surveys that go out, 1,200 are returned. Of these 1,200 surveys that were completed, 960 agreed with the policy change and 240 disagreed. Which of the following statements are true?
- Some of the mailings may have never reached the parents.
- The school district has strong support from parents to move forward with the policy approval.
- It is possible that majority of the parents of high school students disagree with the policy change.
- The survey results are unlikely to be biased because all parents were mailed a survey.
(a) Only 1 (b) 1 and 2 (c) 1 and 3 (d) 3 and 4 (e) Only 4
Sampling Errors
There are a number of ways things can go wrong. Some examples:
- non-response
- self-selection
- framing bias
- sensitive topics
- interviewer bias
- timing